
When you look at a stock chart, it’s important to understand the technical elements that drive price. These include Volume, Trend lines, and Support and Resistance levels. You can use this information to predict future price movements. However, you should also be aware of the risks associated with investing in a stock.
Moving averages
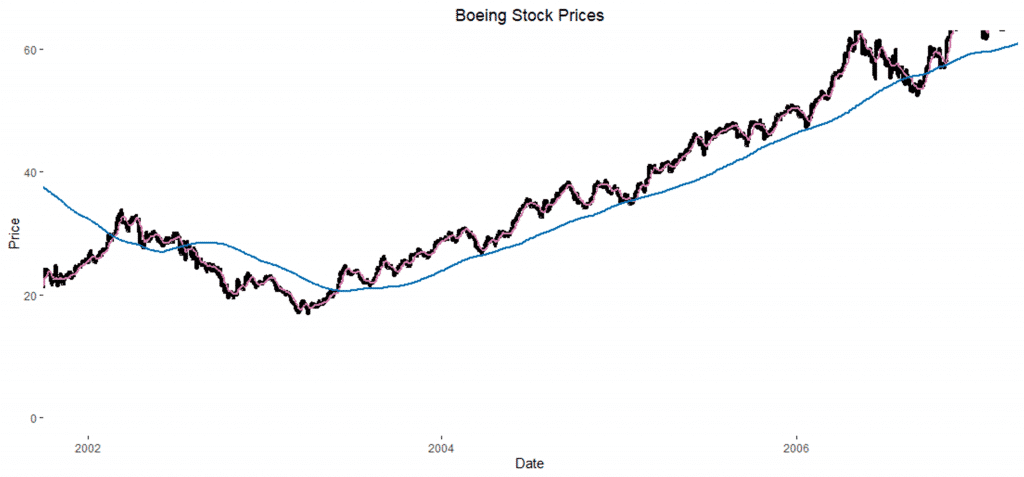
Moving averages are useful tools for stock market traders. They measure a stock’s price trend over time and can help identify buying and selling signals. These averages also measure momentum, which helps you trade a stock at the right time. The 50-day moving average is an example of a moving average. It is calculated by taking 50 days of closing price data and averaging it over them.
The average price of a stock is calculated by dividing the sum of the previous CLOSE prices by a certain number. The resulting average price can then be plotted in a chart. Moving averages are often displayed alongside price bars, in the same graphic pane. The main difference between moving averages and the average price is that the moving average is slower than the price of a stock.
Trend lines
Trend lines in stock charts can help you to identify potential trading opportunities. A trend line connects a stock’s highs with its lowest price, and when a stock reaches this support level, buyers anticipate that it will bounce higher. This means that momentum traders and investors should look for opportunities to buy near the low. However, if a stock breaks this support line, it is a sign that something is wrong.
Trend lines can also identify areas where a stock’s demand and supply are increasing. For example, if a trendline is rising, this means that the stock has more demand than supply. However, the slope of the trendline can vary. For example, some securities will show an uptrend for months and a downtrend for a few days, while others may show a sideways trend.
Volume
Volume in stock charts is a way to see what is driving the price of stocks. If the volume is low, then a stock is not performing well and investors do not see a bright future for it. As a result, the price will go down. But if the volume is high, then it is likely that a stock will continue to rise.
Moreover, higher volume indicates more interest in a stock. It is also a sign that the price is moving up. If the volume goes below the average, then the price may go down.
Support and resistance levels
Support and resistance levels are an important part of stock charts, as they serve as entry and exit prices for a trade. When a stock hits a support level, it is likely to bounce back. When it hits a resistance level, it is more likely to break through and move in the opposite direction. Traders often confirm the best exit price points by analyzing the price behavior around each level.
The resistance level is not necessarily a price, but an area of price. This is because investors don’t act in concert when a stock approaches a resistance point. Some investors will sell before the price reaches it. This means that a stock near the $39 level could stall earlier than expected. On the other hand, a strong buyer’s trend may cause the stock to rise above the resistance level, ultimately pushing it to a higher price. As a result, different chartists use different methods to identify resistance levels. Some will connect the absolute high and low points, while others will draw a line through congestion areas.
Breakout stocks
A breakout stock is one that has just passed a major support or resistance level. Active investors use breakouts as a part of their investment strategy. They help them identify stocks that are likely to make significant moves. These stocks are typically characterized by high volumes and high price action. Using technical analysis tools, they can be identified and traded.
Before attempting to trade breakout stocks, it is important to understand the pattern. Breakout stocks should have clearly defined resistance and support areas. If they’ve broken these support or resistance levels more than twice, this is a sign of a more powerful breakout move.